4.3. Setup - Monitoring
Authorized users and VPN users
This section contains data about users authorized on the server, interfaces, and CPU utilization, as well as traffic data in real-time.
Authenticated users
The full list of users authenticated in UTM can be viewed as a table in the section Monitoring -> Authorized users.
| Status | Description |
 |
Connected. The user is authorized. |
 |
License limit exceeded. This session is locked. Appears if the number of licensed users is exceeded or the user already has 5 active sessions. |
 |
The session is deleted. Appears if a session with a dynamic IP address has been terminated. A session with this status will be deleted after 30 seconds. |
An example of a table with authorized users can be seen in the screenshot below: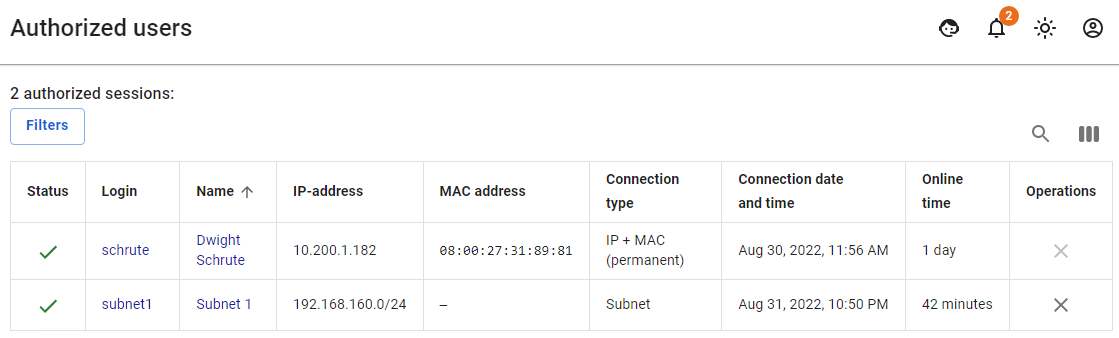 If necessary, a user can be re-authorized in the Operations column.
VPN Users
The section Monitoring -> VPN users displays the list of all users in whose user settings Allow Remote Access via VPN is enabled, and who have been authenticated via VPN.
An example of a table with users connected via VPN can be seen in the screenshot below: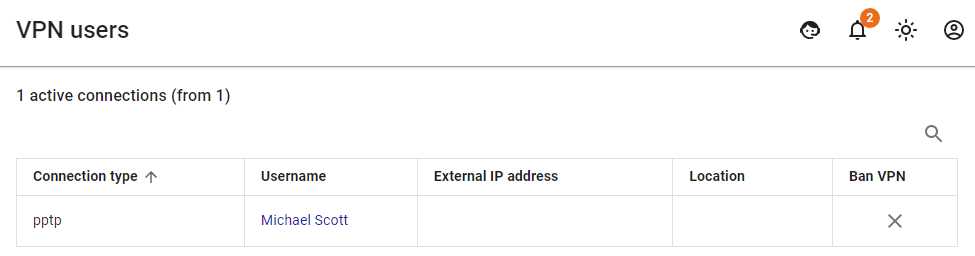 If you click on the "X" button in the Ban VPN column, then UTM will deny this user a VPN connection and clear the Allow remote access via VPN check box in the Users -> User & Group section.
System Monitoring
Contains general statistics on authorized users, the number of VPN connections, CPU and disk usage, etc.
This module allows you to view graphs about the state of UTM in real-time. The horizontal scale of the graph is always time (depending on the selected interval).
Statistics are stored for up to 90 days.
In the event that a backup node in the Cluster becomes active, statistics from the previously active node are not transferred to the new one but will continue to be stored for up to 90 days.
System
Contains information:
- About the number of authorized users
- Processor load percentage (the sum of percentages from all cores is indicated)
Example:
There are eight cores in total, and the peak load value for one core is 100%. Thus, the maximum possible value on the graphs is 800%. - The amount of RAM used in GB
Network
Contains summary information about incoming and outgoing traffic for a certain time, transmitted via UTM on all interfaces specified in the Network interfaces section.
These stats can help you set up channel reservations, both static and dynamic channel aggregation.
Disks
Contains statistics on the volume of written and read the information (Disk graph) in a certain period of time and the number of disk accesses for the same period of time (I/O operations graph). Provides an estimate of disk usage. Information about free and used disk space is available in the Backup section.
VPN
Contains information about the number of user connections via the L2TP/IPsec, PPTP, and IKEv2 protocols.
Instructions for connecting users to a VPN are available here.
Traffic Monitor
The section Monitoring -> Traffic Monitor displays data about traffic (inbound/outbound, speed, number of sessions) passing through SafeUTM in real-time.
In order to enable traffic monitoring, you need to launch the Application Control module.
By nodes of the local network tab allows to track network users’ activity and identify those who load the channel with traffic.
An example of a tab window with traffic monitoring by nodes of the local network can be seen in the screenshot below: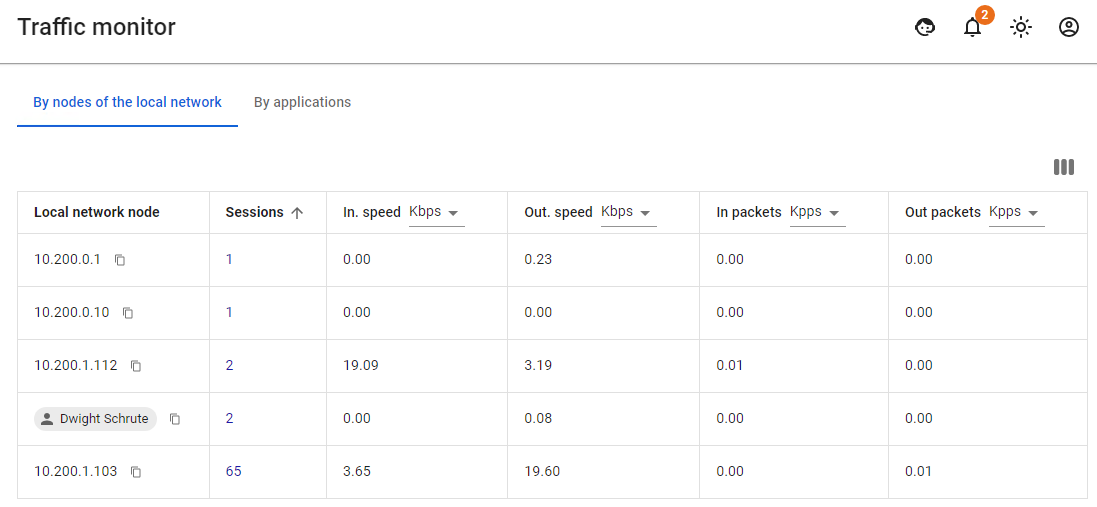 For example, if a user does not load the channel with traffic, but the table displays a big number of data packets, then it is possible to identify an application with suspicious activity in the By applications tab.
An example of a window with traffic monitoring by applications can be seen in the screenshot below: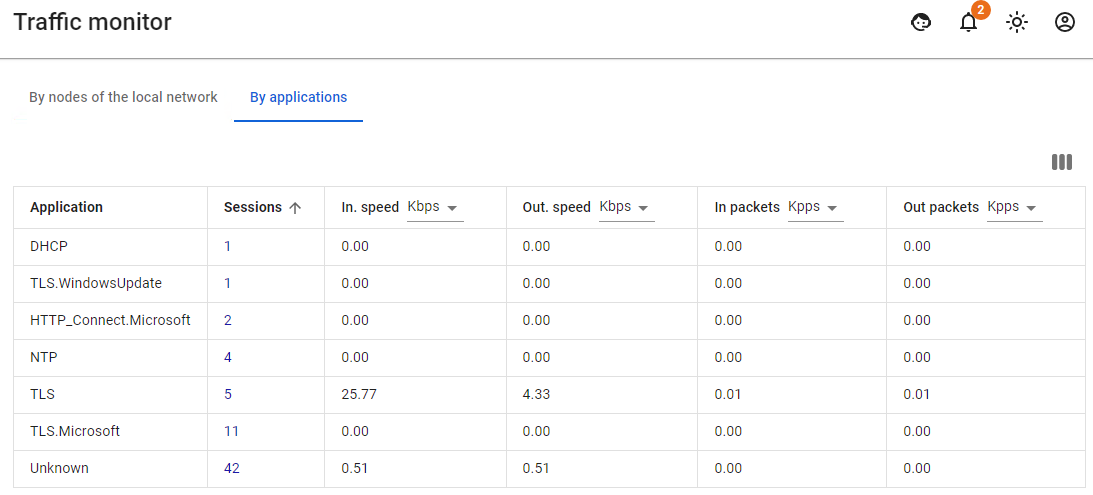
SNMP
To switch the section to working mode, switch the slider to the On position.
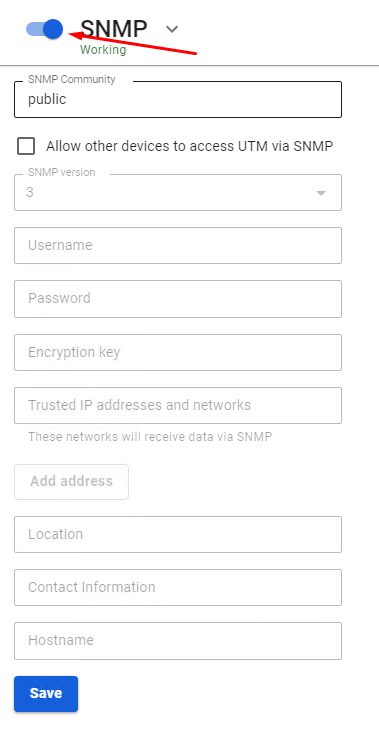
This module allows you to monitor the operation of SafeUTM using the SNMP protocol versions 1/2c and 3. To do this, you need to configure the login, password, and encryption key.
You can also add IP addresses and networks to trusted ones so that they can access data from SafeUTM. Location, Contact information, and Hostname fields are only for information and are optional.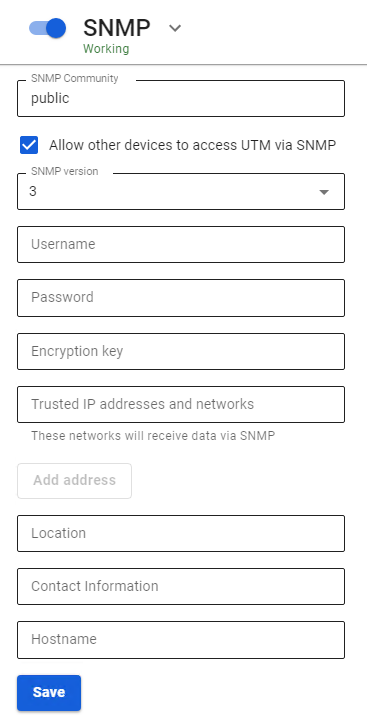
Syslog
Enabling this module makes it possible to transfer all SafeUTM system messages (Syslog) to third-party collectors (Syslog Collector) or to SIEM systems.
Forwarding System Messages
Any private (local) or public (external) IP address can be specified as a collector.
In the Port field specify any port from the range 1 to 65535.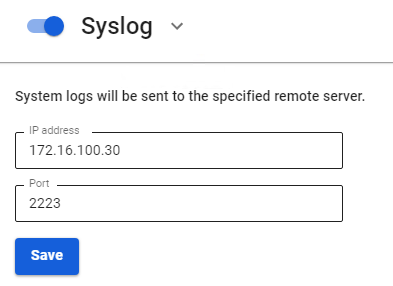
System messages are transmitted according to RFC-5424 (UDP transport).
Zabbix
Zabbix is an open-source enterprise-class distributed monitoring solution.
You can find information about Zabbix on the official Zabbix page.
You can also try Zabbix as a ready-made solution or install it using Zabbix documentation.
Integration with Zabbix
Integration with the Zabbix monitoring system is possible in two modes:
1. Active mode, where connection to Zabbix server is initialized by SafeUTM. To set up this mode, fill in the following fields:
- SafeUTM hostname that will be displayed on the monitoring server.
- Server Address – IP address, domain name, or IP-address:port, domain name:port in cases where an incoming port that is not standard for Zabbix is used. To add one more address, click Add Address.
2. Passive mode, where the connection is initiated by the Zabbix server. To set up this mode, fill in the following fields:
- Connection port – choose port 10050 or 10051.
- Server Address – IP address or domain name of Zabbix servers. To add one more address, click Add Address.
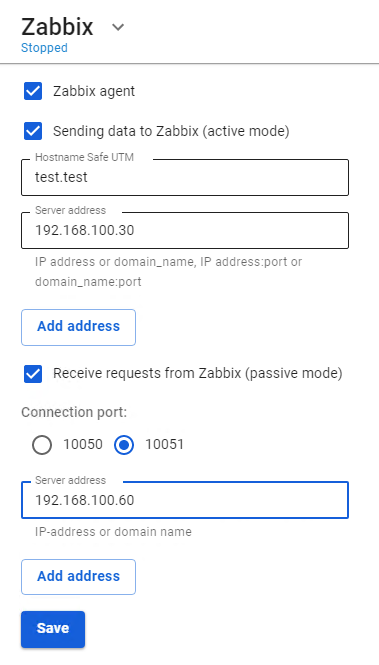
In both cases of integration, the Zabbix server must be located inside the SafeUTM LAN. Monitoring can only be connected to local interfaces.
Standard templates for Linux servers can be used as data templates.