The time and date in the widget are displayed in the server's time zone.
**Examples of using:** **A)** Which prohibited sites a certain user went to: - Open the section **Reports -> Traffic**; - In the **Top Users** widget, find the desired user and click on it. If the user is not in the list, then click **Expand** (monitor icon) in the upper right corner of the widget (a list of all users will open); - In the **Top Blocked Sites** widget, UTM will show the top 5 blocked sites. To view the full list of blocks, click Expand (monitor icon). **B)** Which users have blocked a particular application: - Open the section **Reports -> Traffic**; - In the **Top Blocked Protocols** widget, find the required protocol and click on it. If it is not in the list, then click **Expand** (monitor icon); - To see a list of all users who have been blocked by this protocol, then on the page that opens, find the **Top Users** widget and click **Expand** (monitor icon). Read more about creating your own templates with statistics in the [**Report Designer**](https://docs.safedns.com/books/46-setup-reports/page/report-designer) article. # Security Events Contains information about the triggering of the rules specified in the Intrusion Prevention section. ---All widgets are generated in the server's time zone.
The section structures the information received from the [**Intrusion prevention**](https://docs.safedns.com/books/44-setup-traffic-rules/page/intrusion-prevention-system) section. --- #### Period selection All displayed data can be filtered by date and time. For example, set some time period (by clicking the "Choose date" button) or use one of the preset filters: [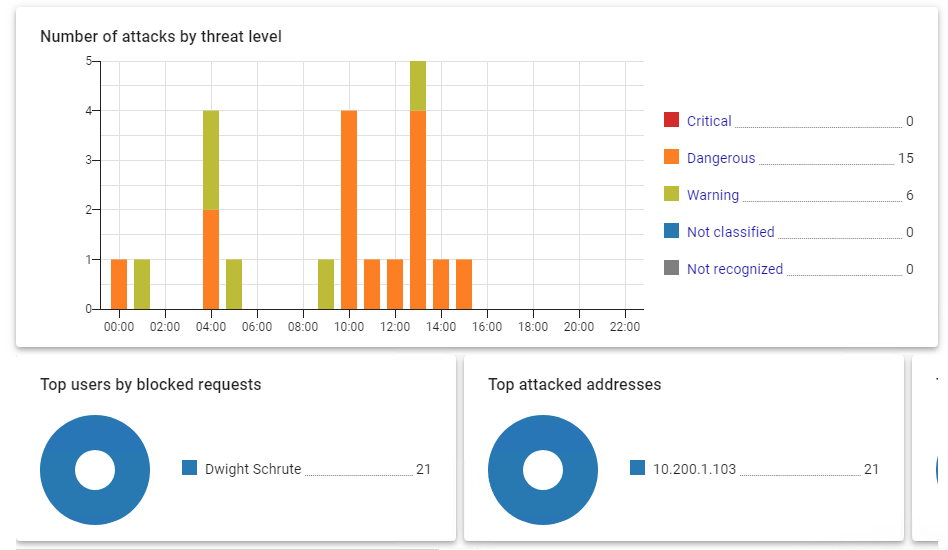](https://docs.safedns.com/uploads/images/gallery/2022-09/vVGozRH2sHjZUk9E-1-security-event-log.png) If no filter by date and time is set, then the interval is set to **Today** in the server's time zone by default. --- #### Widgets All information collected by widgets is presented in detail in the form of a table at the bottom of the section. In it, you can find the ID of the rule that worked and, if necessary, create an exception in the **[Intrusion prevention](https://docs.safedns.com/books/44-setup-traffic-rules/page/intrusion-prevention-system)** section. ##### Number of attacks by threat level The information is provided in the form of a graph with five security threat values: - **Critical** - threat level 1. - **Dangerous** - threat level 2. - **Warning** - threat level 3. - **Not classified** - threat level 4. - **Not recognized** - threat level 255. Widget example Number of attacks by threat level: [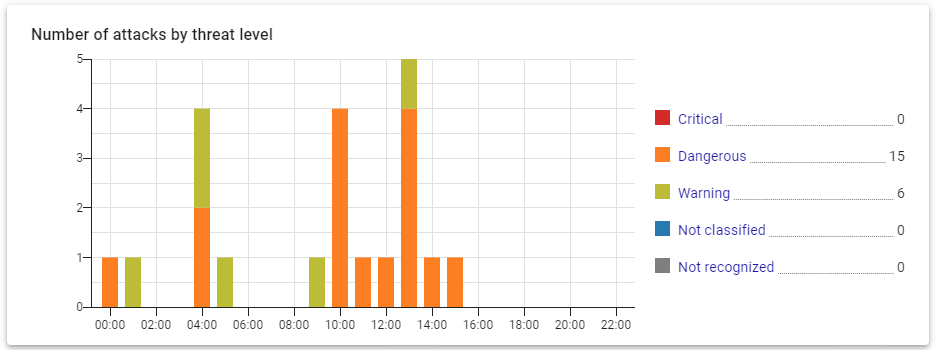](https://docs.safedns.com/uploads/images/gallery/2022-09/a7vgOa8MPGePyiSp-2-security-event-log.png) When you click on a threat level, all widgets and the table filter the content for that level. To go back to the list of threat levels, click again on the selected level: [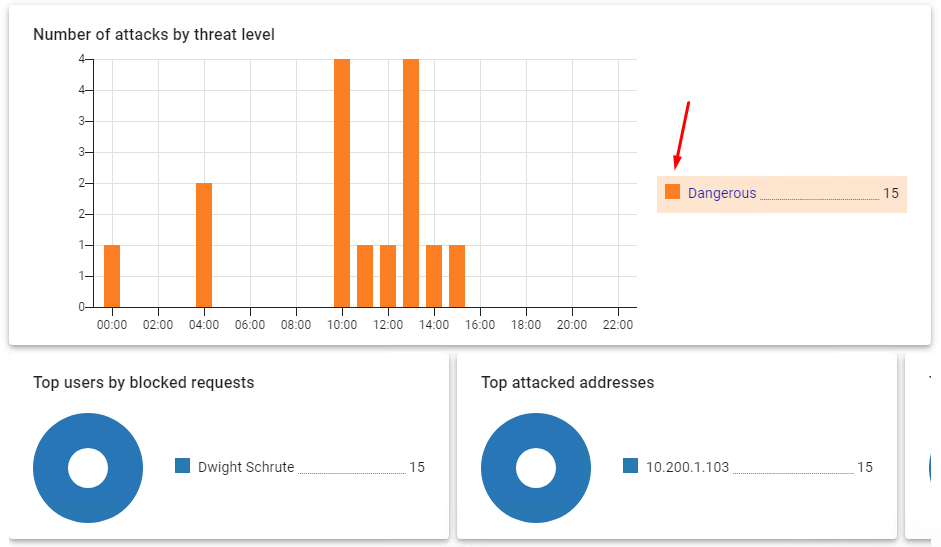](https://docs.safedns.com/uploads/images/gallery/2022-09/MiuExJp0w5otl38s-3-security-event-log.png) ##### Top users by blocked requests Only those users who were successfully authorized get to the top. Thus, unauthorized users whose requests were blocked will not get into the diagram. ##### Top Attacked Addresses Both external and internal areas fall into that of the attack. One example where the attacked address is external is when a Trojan operates from inside the protected network. ##### Top attacking addresses The attacking address can be either external or internal. For example, the address from which the work of the Trojan was recorded can be considered an internal attacking address. ##### Top Blocked Attack Types The widget calculates the statistics of attack types (for example, attack types IP Address Blacklist or Attempts to obtain administrator privileges, combining a group of several rules) by the number of hits with this type of attack. The type of attack is listed in the Security Event column in the table at the bottom of the section. ##### Top attacking countries The top attacking countries are based on the IP addresses obtained when the rules in the Intrusion Prevention section are triggered. If an IP address is not geocoded into a country name, that address is not displayed in the widget. For this reason, local IP addresses are not shown in the widget. # Authorization Log In the Reports -> Authorization Log section, a list of users authorized on SafeUTM is available to you in the form of a table. --- [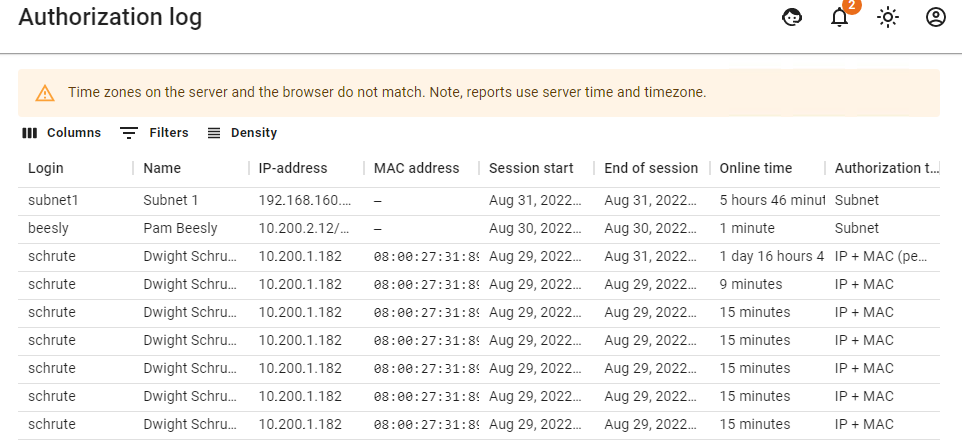](https://docs.safedns.com/uploads/images/gallery/2022-09/qhQZQ16oyt1ZJ51s-1-security-event-log.png) You can use the possibility to search for specific authorized users with a filter. To do this, at the top of the screen in the **Column for the filtering** field, select one of the suggested parameters (login, name, IP address, session start, session end, authorization type). In the last field, enter the value that the column you selected should include. **When using a filter, there is a certain feature:** - For an open session, this session is recorded in the database every 5 minutes, and the current time is recorded in the "end of session" field. Accordingly, if the first request was sent before the buffer synchronization, then the end time will be returned. And if the next request occurs after the moment of synchronization, the end time for the open session will change, and a new one is returned. - For a completed session, the information about the closing time does not change. # Report Designer Setting up statistics in custom reports and sending ready-made reports to e-mail. --- UTM provides the ability to create report templates and set up their distribution in .pdf format by e-mail. --- #### My templates This tab creates templates with statistics that can be viewed in a browser, saved as a .pdf, or sent via email. Clicking the **Add** button will open the template settings menu. Set the time period, report the name, and click **Add Widget**. One template can contain multiple widgets. Widget setup: - In the **Grouping** line, select the object for which statistics will be collected. If you select a **Specific** object (for example, a Specific user or a Specific group), then an additional line of **Objects** will appear, where you can select multiple objects; - In the **Widget** line, specify what information you want to see on the selected object; - Set **Display settings**. After you finish customizing the template, click **Create**. [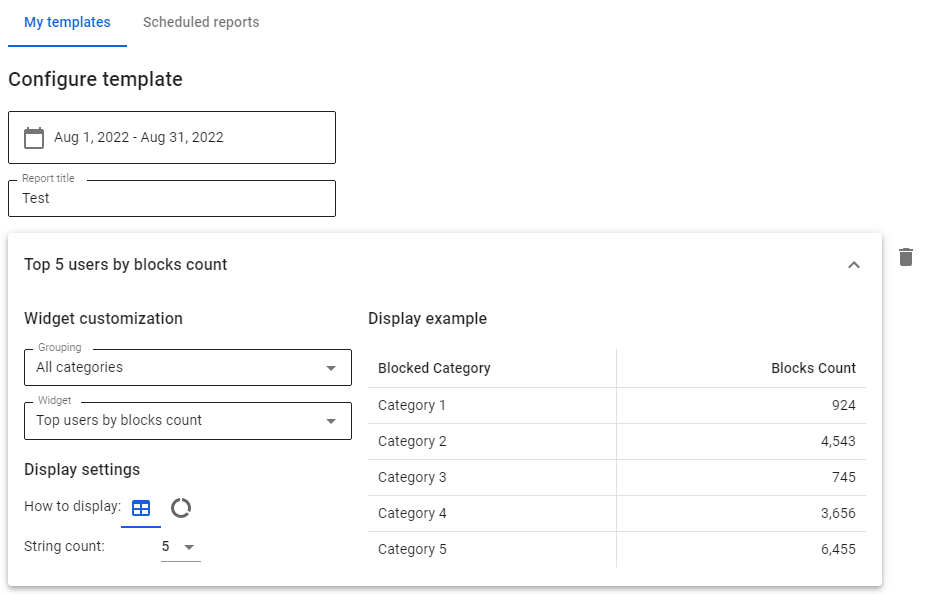](https://docs.safedns.com/uploads/images/gallery/2022-09/pMItuWmB9uN3chyu-1-report-designer.png) --- #### Scheduled reports This tab provides the ability to create/edit settings for sending email campaigns. To create a setting, click **Scheduled Reports -> Add** in the upper left corner. In one setting, you can specify several e-mail recipients (the **Add recipient** button) and several reports (the **Add report** button). Reports will be sent to: - **Once a day** - sending will occur the next day after saving if the sending time is less than the current one on the server. - **Once a week** - specify the day and time of sending. - **Once a month** - specify the day and time determined by the account or every 1st day of the month. If the 31st is selected, but there are fewer days in the month, then the last day of the month is selected. [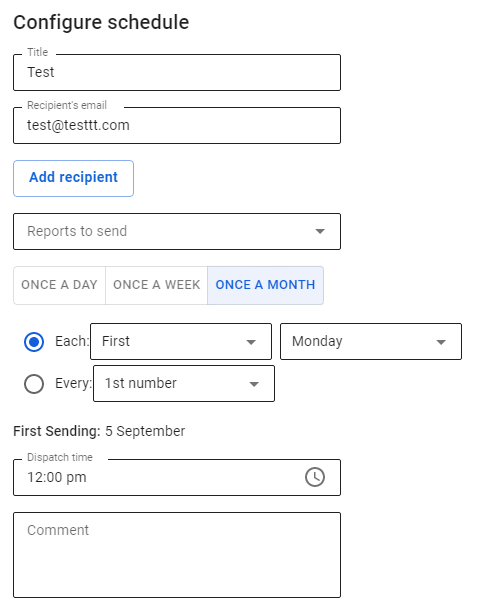](https://docs.safedns.com/uploads/images/gallery/2022-09/6espHLJmxWhwS4iC-2-report-designer.png) When you click on the **Create** button, UTM will save all user send time settings in all filters (once a day, once a week, and once a month), but the template will only be sent during the period selected by the user. For example: 1\. When creating a report, the time period is set: - Once a week; - Day of the week - Thursday; - Click Create. 2\. Proceed to edit the report by clicking the **Edit** button and changing the time period settings: - Once a month; - Every other Wednesday; - Click Save. 3\. Go back to editing the report and select **Once a month**, the settings created in step 1 will open. **Example**: You want to set up sending a report with information about blocked sites for all users every first day of the month. The first thing to do is to create a report template based on which statistics will be collected for sending: 1\. Click **Add** in the **My Templates** tab; 2\. Select the time period for which the report should be generated from the proposed filters or specify the dates by clicking **Select a date**; 3\. Specify the name of the report (line Report name); 4\. Click the **Add Widget** button; 5\. Fill in the lines: - **Grouping** - select **All users**; - **Widget** - select **Top blocked sites**; 6\. Specify **Display Settings [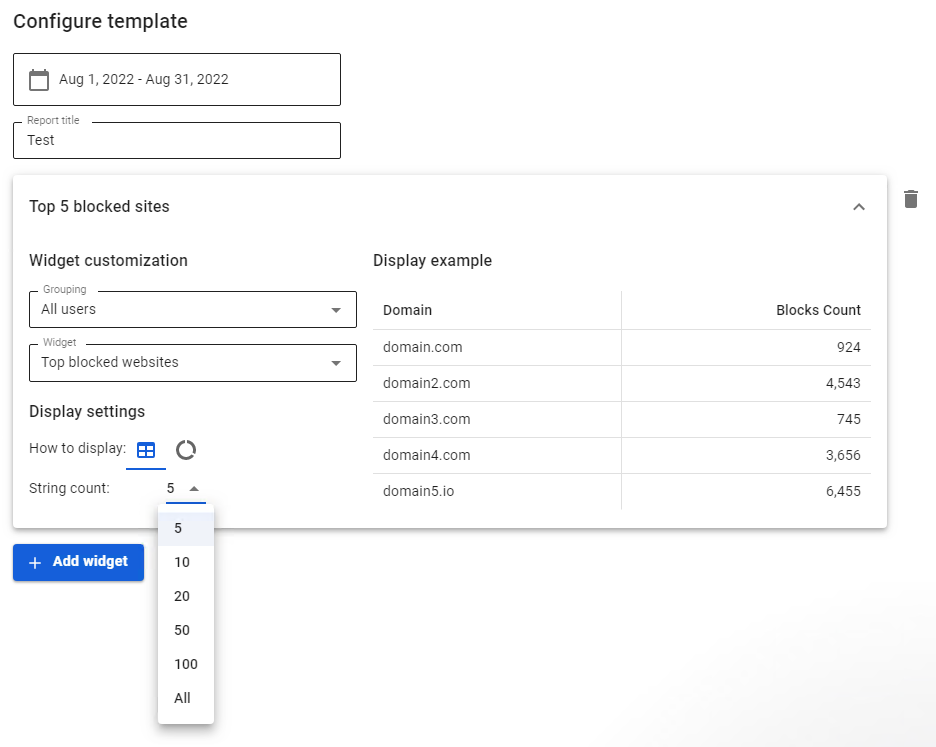](https://docs.safedns.com/uploads/images/gallery/2022-09/odeU5SFGxiJt4CH7-3-report-designer.png)**7. Save the template by clicking the **Create** button. Create a rule by which the report template will be sent to email: 1\. Click **Add** in the **Scheduled Reports** tab; 2\. Fill in the lines: - **Name** - any name that will help you identify the schedule rule; - **Recipient's email** - e-mail of the recipient of the report. If you need to send a report to several recipients, specify additional addresses by clicking the **Add recipient** button; 3\. Select the required template in the drop-down list in the line; 4\. Specify the date/day and time settings for sending the report to the recipient.