Traffic
Statistics from Application Control and Content Filter.
The section automatically collects statistics from the Content filter (categories and sites) and Application Control (protocols), collecting it into widgets with default filters.
Information display method:
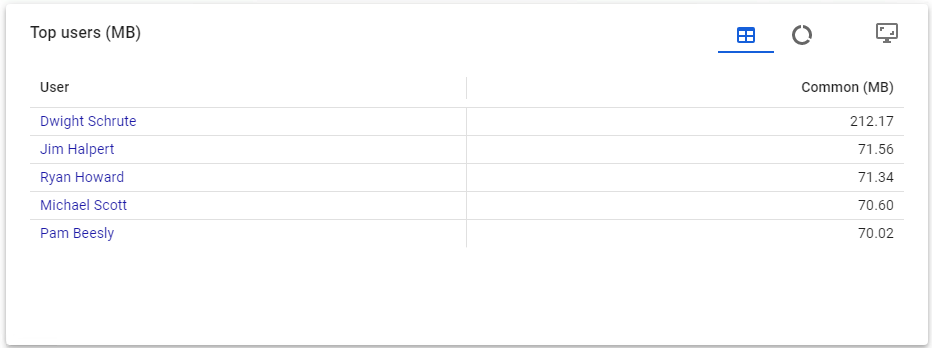
Pie Chart (pie icon) and table (table icon)
Contains the top 5 objects. Each object is clickable and leads to a page with widgets in which statistics are filtered for this object.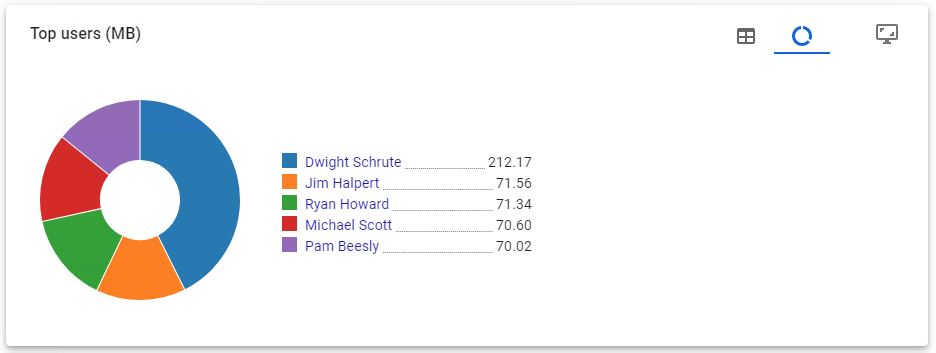
The unit of measurement can be changed in the upper left corner: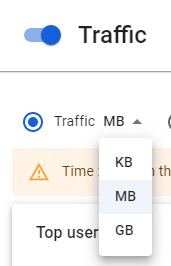
Expanded mode (monitor icon)
Contains data on all objects from the top. To search by objects, use the Filter (filter icon).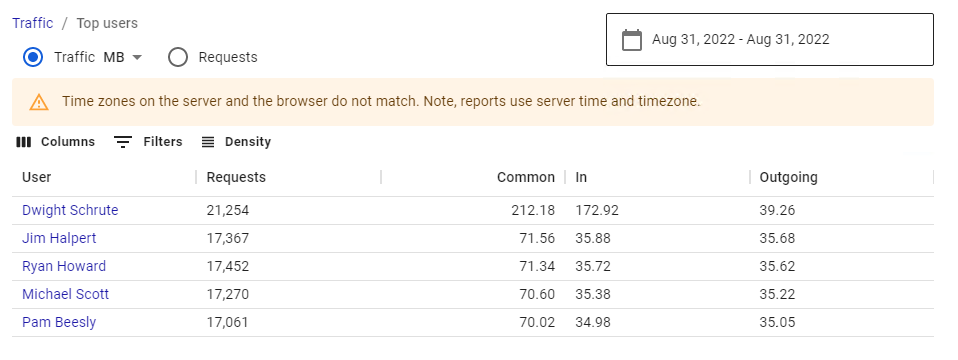
If the flag in the Requests line is set in the upper left corner, then the objects will be filtered in descending order by the Requests column. If Traffic, then in descending order in the Incoming column.
To save the result to a CSV file or print a spreadsheet, click Export (download icon).
The time and date in the widget are displayed in the server's time zone.
Examples of using:
A) Which prohibited sites a certain user went to:
- Open the section Reports -> Traffic;
- In the Top Users widget, find the desired user and click on it.
If the user is not in the list, then click Expand (monitor icon) in the upper right corner of the widget (a list of all users will open); - In the Top Blocked Sites widget, UTM will show the top 5 blocked sites. To view the full list of blocks, click Expand (monitor icon).
B) Which users have blocked a particular application:
- Open the section Reports -> Traffic;
- In the Top Blocked Protocols widget, find the required protocol and click on it. If it is not in the list, then click Expand (monitor icon);
- To see a list of all users who have been blocked by this protocol, then on the page that opens, find the Top Users widget
and click Expand (monitor icon).
Read more about creating your own templates with statistics in the Report Designer article.